Finding one instruction is useful. Understanding the surrounding feature is better.
Section: Start from a known anchor.
In an offline Wesnoth 1.14.9 match, recruiting a unit reduces the player’s four-byte gold value by that unit’s price. The instruction that writes the reduced gold is our anchor. Set a code breakpoint on the instruction you verified in the debugger, recruit one unit, and let the breakpoint fire.

The current function probably handles a small part of recruitment. To discover who asked for that work, look at the call stack or run until the function returns.
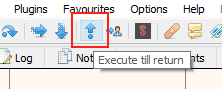
Now you are back in the caller. Repeat this carefully to move from the low-level write toward the broader decision that requested it.
Section: Why the caller is visible.
When x86 executes call, it places a return address on the stack before jumping to the callee. That address points to the instruction the caller expects to run next. A debugger’s call stack combines return addresses with known module ranges and function information to show the nested route that reached the breakpoint.
The call stack a debugger shows is a reconstruction, and it may be incomplete. Optimizations can inline functions, reuse stack space, or omit traditional frame pointers. Confirm an important caller by returning to it or placing a breakpoint at its call site and reproducing the action.
Section: Distinguish the frame from the object it points to.
The stack is one place a running function keeps its bookkeeping and temporary values. It is not the home of every object the function uses:
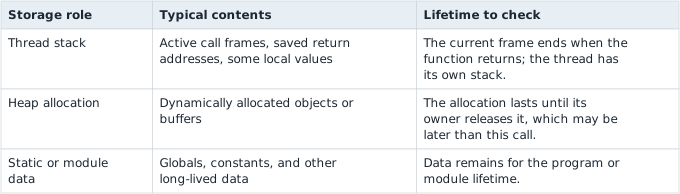
These are roles in virtual memory, not three physical kinds of R A M, random access memory. Windows describes thread stacks and heaps; Microsoft’s C++ storage-duration guide explains why a local static value can survive repeated calls. A compiler can also keep a local in a register or eliminate it entirely.

In brief: The location of a pointer is not the location of its object. Ending a raw-pointer stack slot does not release its heap allocation. An owning local can release that allocation when it is dropped during return.
Section: Read one concrete 32-bit call frame.
Here is an illustrative near call with no arguments, not an address from Wesnoth. A five-byte call at this value must resume at this value. Start with e s p equals this value and caller e b p equals this value:
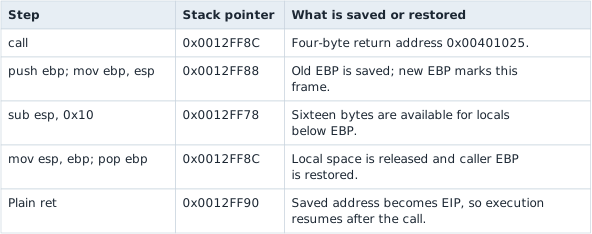
A conventional e b p frame makes the saved return address visible at e b p + 4. The values below are illustrative and the call has no arguments.


Intel’s CALL and RET descriptions define the instruction behavior. The e b p prologue is a conventional frame layout, not something call creates by itself. Releasing or popping stack space need not erase its old bytes, so readable leftovers do not prove a local object is still alive. The compiler caveats above explain why a real optimized call may have a different layout.
Section: Establish context by following the observed call chain.
Here, establishing context means connecting a stored change to the specific player, requested action, operands, and checks that caused it. At the gold write, knowing “subtract 25” is incomplete: is that an item price, a fine, or a different player’s payment?
The original course called the move from a small helper toward its callers bubbling. Treat that name as a method, not a promise that every caller has a recoverable source name. Record each confirmed level:
Context cheatsheet: keep these levels together when following a write toward its callers.
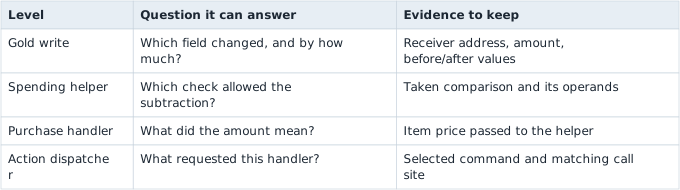
Reproduce one action, confirm its write, inspect the caller, and repeat until you can explain that action. Compare a second action that shares the helper: it can reach the same write for a different reason. A breakpoint above the shared helper needs that caller context to distinguish them.
The final steps inspect a recorded path; they do not rewind or repeat a purchase. In a live debugger, Run until return executes the rest of the current function. Step over executes a call and pauses after it returns; Step into follows its executed instructions. None undoes previous writes. Note the current values again after running, and distinguish an inferred call stack from a call site you reproduced. Inlining and tail calls can remove an ordinary call/return boundary.
In brief: Bubbling follows confirmed callers toward the action. Keep the player, arguments, checks, and result together so one shared helper is not mistaken for one feature.
Section: Recognize dispatcher code.
Menus often use a chain of comparisons:
Code example. The surrounding prose explains this example; the full lesson contains the exact code.
The constants will not have friendly names in the debugger. You create those names from experiments.
Triggering one menu item at a time shows which branch each one takes. In one run of this book’s build:
Code example. The surrounding prose explains this example; the full lesson contains the exact code.
Those destinations belong to one run of one build, and yours will not match. What carries over is the shape: two actions, two constants, two different branch targets, all from the same comparison chain.
Once each constant is matched to an action, the anonymous numbers become an enum:
Code example. The surrounding prose explains this example; the full lesson contains the exact code.
The enum is your model, not a claim about the original source type.
Narration: Your names for 3 and 5 come from experiments, so they are a working model. If a new test breaks the model, rename it.
The comparison value alone is not enough. Where it came from matters: a register, a stack argument, or a field inside a menu object, and whether another branch changed it before the dispatcher. Those details distinguish “menu command ID” from a temporary loop counter that merely happened to equal 3.
Section: Separate “where” from “why”.
The gold instruction tells you where a change happens. The menu dispatcher tells you why execution reached it.
That distinction matters:
patching the subtraction changes the stored cost result;
changing a branch may select a different feature;
hooking the dispatcher lets you observe every menu action.
Do not make all three changes at once. Test one layer at a time.
This is also a lesson about abstraction levels. The subtraction is a low-level side effect. The recruitment function groups validation and side effects into one operation. The dispatcher chooses among operations. Moving upward explains more behavior but also adds more unrelated branches, so stop when the original question is answered.
In brief: The write shows where gold changes, and the callers show why. Stop climbing once you can answer your question.
Section: Follow dependencies, not just nearby instructions.
“Backward” does not simply mean scrolling upward in the disassembly. It means following the facts that had to be true for the anchor instruction to run.
A data dependency asks where an operand came from. If e a x is the price, find the instruction or argument that produced e a x.
A control dependency asks which comparison allowed this block to run. If a branch skipped the subtraction, determine what value controlled that branch.
A call dependency asks which caller requested this operation and what arguments it supplied.
Compilers can move calculations away from the source statement that inspired them. The instruction immediately above the anchor may be unrelated, while the important value was loaded twenty instructions earlier or passed by the caller. Track one value and one decision at a time.
A practical stopping condition is: stop tracing callers when you can name the input, the decision, and the observable result in plain English. Going farther may reveal the whole menu framework, but it no longer answers the focused gold question.
Alternative: Think of tracing a delivery: who ordered it is the caller, where the goods came from is data, and which check let it ship is the branch.
Section: The three questions, asked once.
Put the anchor from Lesson 2.5 back on screen and ask all three of them about it. Writing sub dword ptr [e s i+hexadecimal 3 0], e a x in the middle, each question pulls in a different direction:
Code example. The surrounding prose explains this example; the full lesson contains the exact code.
They are genuinely different searches, and the answers usually live in different places. e a x may have been loaded two instructions above, or handed in by the caller and untouched since. e s i is the one that matters most here: find where it was set and you have the object the field belongs to, which is the whole of Lesson 2.8. The comparison that guarded the block may sit immediately above, or in the caller, having already decided this purchase was affordable before the call was made.
Answering them one at a time matters. The common way to get lost is to chase e a x upward, notice an interesting branch on the way, follow that instead, and end up unable to say which question you were answering.
Section: Find every caller without running it.
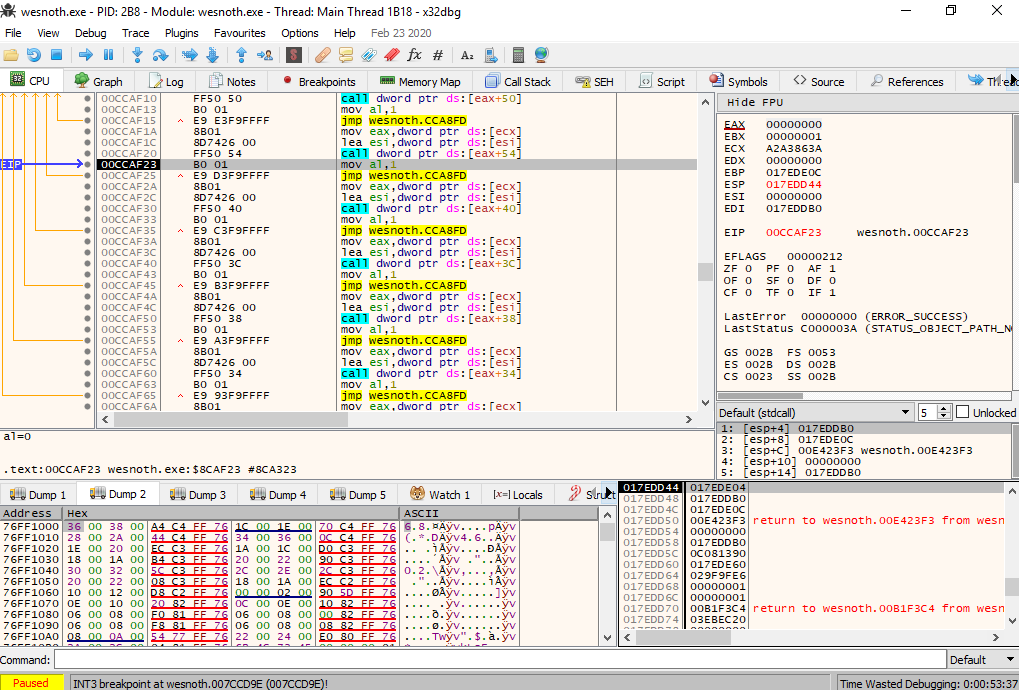
The call stack lists the one route that reached your breakpoint this time. The code itself can list every route. A direct call is the byte E8 followed by a four-byte distance, stored lowest byte first, which the C P U, central processing unit, adds to the address of the next instruction. Work out that target for every call in the module, keep the ones that land on the first byte of the function you are in, and you have its callers. Each one is a cross-reference: a place in the code that refers to this address. In x64dbg, right-click the function’s first instruction and choose Find references to, then Selected Address(es).
Take an illustrative helper that starts at this value. A call at this value stores DB 0F 00 00, which read lowest byte first is this value. The next instruction starts at this value + 5 equals this value, and this value + hexadecimal F D B equals this value, so this call is a caller. A distance whose top bit is set counts as a negative number, which lets a call reach backward; the calculator’s second example works one out.
The two lists answer different questions. A cross-reference shows that an instruction can call the helper, and the call stack shows which caller did. An indirect call such as call e a x takes its target from a register while the game runs, so it never appears in the cross-reference list.
Predict first
During one recruit the call stack showed a single caller, at this value. The cross-reference list also has a call at this value whose target is this value.
What does the second call site tell you?
Answer: Some other action can reach the same helper, and a breakpoint on this value shows which. Both calls land on this value, so the helper serves at least two callers. Breaking on the second call site and trying other actions that spend gold names the one that uses it.

Section: Restore before changing direction.
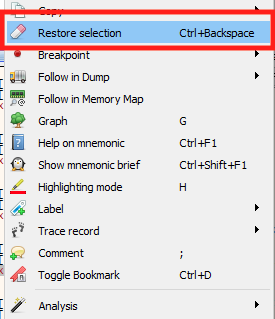
Use x64dbg’s restore command after every temporary patch.
Then verify:
original bytes are back;
the normal menu behavior works;
no stale breakpoint remains.
Section: A plain-English function sketch.
The recovered behavior fits in a few lines of pseudocode:
Code example. The surrounding prose explains this example; the full lesson contains the exact code.
Pseudocode separates the idea from register names and addresses, so the same sketch describes the function in any build even though every address changes. Parts whose purpose is not known yet can keep neutral names instead of invented ones:
Code example. The surrounding prose explains this example; the full lesson contains the exact code.
Section: From a write to a menu action.
The gold write supplied a known starting instruction. Its return address and call stack led to the caller; recruiting and opening Terrain Description supplied contrasting cases for the menu branch. The small pseudocode model names only behavior those cases supported. That route from an observed write to a caller, branch, and named action also works when the compiler has removed the original source names.
That explanation identifies the action and its checks, but the address of its instruction still belongs to one run. The next question is how to find the same game state after a restart: why addresses move, and which relationships between objects can survive the move. Once those are clear, we can return to changing control flow itself.