A pause at a breakpoint may change a timer reading without changing any game rule. A debugger event is likewise evidence about the environment, not a verdict about the player’s actions. We will use threads, timers, and a small state machine to keep the signal, decision, and response separate.
Section: Treat the behavior as a protocol.
An anti-debug routine is often described as a bag of checks. That view hides the important part: what state does each observation cause, and which game behavior changes afterward?
Model it as a protocol with inputs, memory, and outputs. For a deliberately small local fixture:

This diagram exposes questions a single if debugger_present cannot answer:
Does one sample cause a permanent decision?
Is there a second observation before behavior changes?
Can a slow frame, breakpoint, virtual machine, or overloaded computer produce the same signal?
Is the response visible in telemetry?
Does the game still enforce its real state invariants?
The target invariant is:
Environmental observations may annotate or pause the experiment, but game state validity is enforced independently at the state-changing boundary.
Section: Separate signal, interpretation, and response.
These two Rust enums make the distinction visible in the type system. A Signal stores one observation; an Assessment names what the detector can reasonably conclude from it. Neither type grants permission to change game state.
Code example. The surrounding prose explains this example; the full lesson contains the exact code.
A signal is measured data. An assessment interprets one or more signals. A response is an action such as recording a diagnostic event or refusing a specific invalid command. Combining all three into one hidden boolean makes it hard to discover false positives and impossible to explain the decision.

In brief: Keep the measurement, its interpretation, and the chosen response separate so each decision can be explained and tested.
Section: What a Windows program can actually measure.
The state machine above is deliberately abstract, which risks leaving the impression that an “observer signal” is one vague thing. It is not. A Windows program can take the signal from several genuinely different sources, and they differ in what they prove, which is why a signal and the assessment drawn from it are kept apart.

Things the loader wrote down. When Windows starts a process for a debugger, it records that fact inside the process itself. The Process Environment Block carries a BeingDebugged byte at offset hexadecimal 0 2, and IsDebuggerPresent is little more than a read of it. The same structure’s NtGlobalFlag field gains heap-checking bits, and the process heap ends up with different Flags and ForceFlags values than it otherwise would. Nothing here measured anything. The loader simply noted what it was asked to do, and the program is reading the note.
Bookkeeping the kernel keeps. A debugged process has a debug object associated with it, and NtQueryInformationProcess will report on that association when asked for ProcessDebugPort or ProcessDebugObjectHandle. Again a record, held somewhere else.
Its own code. Lesson 2.4 showed that a software breakpoint replaces a byte with hexadecimal C C. A checksum over its own instructions notices that change.
Thread context. A hardware breakpoint changes no code bytes, so a checksum misses it entirely. It lives in the C P U, central processing unit,’s debug registers — d r 0 through d r 3 holding addresses, d r 7 holding enable and condition bits — and those registers are part of a thread’s saved context. A debugger can inspect a suspended target thread with GetThreadContext. Windows explicitly says a call on the current running thread can return success with an invalid context; the return code alone is not evidence of its live debug-register values.
That pair is worth sitting with. Neither kind of breakpoint is invisible, and neither is universally visible; they leave traces in different places. A program checking only its bytes never sees a hardware breakpoint, and one checking only its debug registers never sees a software breakpoint.
Narration: Checking instruction bytes and checking debug registers observe different places. A negative result from one does not settle what the other would show.

Who handles an exception first. A program can raise an exception on purpose and see whether its own handler runs. If something else took it, something else is attached.
The surrounding machine. Parent process, window titles, the module list.
Sort these by what they would establish and the picture changes. The first two are records the operating system keeps, and a determined observer can change what those records say. The middle two are the program noticing traces of your tools inside its own address space and thread state. The last one is about the machine, not about this process, and can be true with nothing attached at all.
None of them establishes that a game rule was broken. That is why environment signals stay separate from validating game state, and why the invariant at the top belongs at the effect boundary rather than anywhere in this list.
Section: Timing detects pauses, not intent.
Suppose code measures how long a tiny operation takes. A large gap might come from a breakpoint, but also from preemption, power management, virtualization, page faults, logging, or a busy machine.
Alternative: A timing gap is like a raised temperature: it calls for more diagnosis because several different causes can produce the same reading.
Numbers make the difficulty concrete. Time the same trivial operation ten thousand times on an idle machine and you might record:
Code example. The surrounding prose explains this example; the full lesson contains the exact code.
Now try to pick a threshold. Set it at 10 microseconds and ordinary background activity trips it several times a minute. Set it above 412 and you have written a rule that almost nothing will ever trigger, including the condition you meant to catch. The distribution of “ordinary but unlucky” overlaps the distribution of “actually paused,” so no single number separates them cleanly.
Repetition gives stronger evidence than one sample, but does not reveal intent. Twenty slow samples from the same code path could reflect a persistent load, power policy, or an attached debugger. That is why the state machine above asks for another sample and then a diagnosis rather than declaring a game-rule violation from a timing number.
Use distributions rather than one magic threshold:
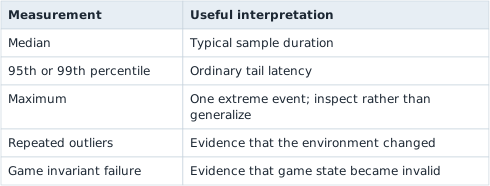
Establish a baseline on the same fixture, retain raw bounded samples, and report the threshold and sample count. A threshold without its distribution is not a reproducible result.
Section: Make the toy detector observable.
Given a measured delay and the recorded 99th-percentile limit from a clean run, this function returns Ordinary at or below that limit and NeedsAnotherSample above it. The event record keeps the input and reason so a later test can reconstruct the decision.
Code example. The surrounding prose explains this example; the full lesson contains the exact code.
The event tells a test what was measured and why it was classified. The next sample can confirm or reject the first interpretation. No branch silently changes unrelated game behavior.
Section: Diagnose the behavior from both directions.
When reversing an unfamiliar routine, trace:
backward from the branch to find the signals and stored history;
forward from the branch to find every response and shared sink;
across clean runs to estimate ordinary variation;
across one controlled change, such as the same fixture run with a breakpoint set, to see which transitions differ;
through failures to determine whether the response is fail-open, fail-closed, or merely diagnostic.
Name the response precisely. “The game detects a debugger” is weaker than “after two samples above the recorded p99, the fixture enters Diagnosing and emits reason timing_outlier; no simulation state changes.”
Section: Test false positives and false negatives.
Build a matrix from conditions you can deliberately create in the fixture:
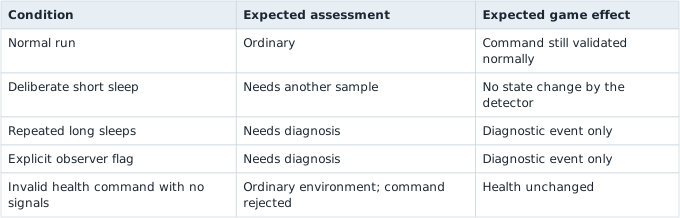
The last row is essential. A quiet environment must not turn an invalid game operation into a valid one.
Section: Glossary terms introduced here.
Signal: one observable measurement.
Assessment: an interpretation based on one or more signals.
Response: behavior chosen after an assessment.
Baseline: recorded ordinary behavior used for comparison.
False positive: an ordinary condition classified as suspicious.
False negative: the target condition occurs without the expected signal.
Fail-open / fail-closed: whether uncertainty permits or refuses an effect.
An anti-debug signal is a measurement, not a game-rule decision. The state machine gives that signal an assessment and a response; timing distributions and ordinary-tool tests expose false positives. Whatever response it chooses, the actual game effect still needs its own state validation.
Reference: Microsoft GetThreadContext documentation.