Section: Define the question.
A call logger should not mean “break on every call in the whole process.” That would be noisy and slow.
Choose:
one module;
one executable section;
one known caller range or target function;
one small time window;
a maximum number of events.
This scope is not just a performance setting. It gives the log a meaning. “These calls happened while one turn ended inside this verified module range” is a result you can reproduce. “The process called thousands of things” is mostly noise.
In brief: A useful trace answers one bounded question; collecting everything can bury the behavior you wanted to understand.
Section: What a call instruction really does.
A function call has two jobs:
remember the address of the instruction that should run afterward;
move the instruction pointer to the called function.
On 32-bit x86, a common direct call begins with opcode E8 followed by a signed 32-bit relative displacement. The C P U, central processing unit, adds that displacement to the address immediately after the call. A disassembler performs this calculation and exposes the final target.
Predict first
At this value the five bytes are E8 4B 00 00 00: the opcode E8, then the displacement this value stored lowest byte first.
Which address does this call go to?
Answer: this value. The next instruction is at this value + 5 equals this value, and this value + hexadecimal 4 B equals this value. The call also pushes this value, so ret comes back there.

An indirect call such as call e a x or call [e c x+8] gets its destination from a register or memory at runtime. Static bytes alone do not reveal one final target, so the first course logger deliberately records only direct calls.
Section: Static discovery and live observation are different jobs.
The logger does not place a breakpoint on every byte equal to E8. That byte may appear inside an immediate value or data. Instead, iced-x86 walks complete instructions and reports their flow-control kind.

Section: Find calls with the decoder.
Use iced-x86 on the copied .text bytes and select direct near calls:
Code example. The surrounding prose explains this example; the full lesson contains the exact code.
NearBranch16 and NearBranch32 are the direct relative call forms used in this 32-bit target. Indirect calls need runtime register or memory values and are a separate feature.
Decoder::with_ip needs both the bytes and their live starting address. The address lets each Instruction report a correct i p() and resolve a relative target. decoder.can_decode() stops at the end of the bounded slice. flow_control() equals FlowControl::Call identifies call-like control flow, while the operand-kind check narrows that set to direct near branches.
The lesson uses decode() for readability. The complete binary reuses one Instruction with decode_out, which avoids constructing a new value on every loop iteration. That optimization does not change the algorithm.
Section: Bound the software breakpoints.
Options include:
one breakpoint on a specific call site;
one breakpoint at a target function entry;
a small rotating set;
an in-process instrumentation hook for a practice program.
Start with one entry breakpoint while learning the state machine. The completed course tool expands to verified direct calls in readable executable regions, excludes known noisy sites, deduplicates addresses, and applies a hard 2,000-breakpoint cap. More instrumentation multiplies state and performance cost.
A software breakpoint changes the first byte of an instruction to hexadecimal C C, the one-byte int3 instruction. When the C P U executes it, Windows pauses the thread and reports EXCEPTION_BREAKPOINT to the debugger. The original E8 must be remembered so the real call can still execute and can later be restored.

Section: The two-event breakpoint cycle.
One breakpoint hit is not enough. If the debugger immediately writes hexadecimal C C back at the same address and continues, the thread hits it forever. The logger temporarily restores the call and single-steps exactly one instruction:
Alternative: Treat restore and re-arm as two separate stops: the original call needs a brief clear path before the breakpoint can watch it again.

At the breakpoint event, Windows reports the address of int3. The logger:
confirms the address belongs to its breakpoint map;
restores the original E8 byte;
opens the event thread and reads its CONTEXT;
rewinds e i p to the call address;
sets bit 8 of e f l a g s, the trap flag;
records that this thread is stepping this call;
continues the event.
The C P U now executes the real call. Because the trap flag is set, Windows pauses after that one instruction with EXCEPTION_SINGLE_STEP. At this moment e i p contains the call destination. The logger clears the flag, reinstalls hexadecimal C C at the call site, removes the thread from the stepping map, and prints the source and destination.
The stepping map is keyed by thread ID because several game threads can hit different breakpoints. A single global “currently stepping” variable would mix their state.
Section: Capture a compact event.
When the single-step pause reveals a call’s destination, copy only the facts needed to answer “who called where, on which thread, and when?” The writer can format this small owned record after the target is running again:
Code example. The surrounding prose explains this example; the full lesson contains the exact code.
Do not automatically dump the entire stack or arbitrary pointed-to memory. Record only what the current experiment requires.
The event is a snapshot of facts already available while the thread is paused. call_site and target explain control flow; thread_id separates timelines; stack_pointer helps compare call contexts without copying unknown stack contents.
Section: Use a bounded channel.
The debug loop and the log writer run at different speeds. A bounded channel holds at most 1,024 copied events; when it fills, the debugger can count a dropped event instead of leaving the game paused while disk output catches up:
Code example. The surrounding prose explains this example; the full lesson contains the exact code.
The debugger thread uses try_send, which fails at once when the channel is full. A bounded channel creates backpressure: it gives the producer a fixed amount of space instead of allowing logs to consume memory forever. Losing a counted event is better than holding every target thread suspended while a disk writer catches up. Lesson 14.6 compares other overload policies for the same bounded queue.
Narration: When the writer falls behind, a visible dropped-event count tells you the log has gaps instead of making the paused game wait for disk.
Section: Resolve addresses after capture.
Keep time-sensitive handling short:

Symbols can be slow or unavailable. A module-relative address is still useful:
Code example. The surrounding prose explains this example; the full lesson contains the exact code.
Address resolution is delayed because the debug-event loop has a deadline: every target thread remains stopped until ContinueDebugEvent. Expensive formatting, symbol lookup, and file I/O belong on a background worker after the minimal register facts have been copied.
Section: Log a versioned format.
The paused thread supplied the addresses; the background writer now records them with a target fingerprint and explicit column names. In this example, one row says that thread 4108 reached a call site at time 15,234 microseconds and the call resolved to the listed target:
Code example. The surrounding prose explains this example; the full lesson contains the exact code.
The version header says how to parse the columns, and the target hash binds the log to one binary so later analysis does not mix runs from different builds. Hexadecimal addresses keep the debugger’s notation. Lesson 14.6 extends the same versioned schema with sequence numbers and correlation IDs that join the events of one action.
Section: Protect the target.
Stop logging when:
the event cap is reached;
the time window expires;
the target exits;
event drops exceed a threshold;
the user requests stop;
a breakpoint cannot be restored.
These conditions form the logger’s safety envelope. The event cap bounds memory and terminal output. The time cap bounds disruption. The drop threshold detects a writer that cannot keep up. A restoration failure stops the experiment because continuing would leave the target executing altered code whose ownership is uncertain.
Section: Divide responsibility with explicit types.
The complete executable uses two maps:
Code example. The code’s comments explain: 🔁 Address to displaced byte: everything needed to restore target code. 👣 Thread to call site: which original instruction is between restore/re-arm.
breakpoints maps each call address to its original byte. A BTreeMap also restores in deterministic address order, which makes diagnostics repeatable. stepping maps a thread ID to the call it is temporarily executing. A HashMap gives direct keyed lookup when the single-step event arrives.
The types prevent two different facts from being blurred together: “this address is patched” and “this thread is between restore and re-arm.”
Section: The Windows debug-event contract.
WaitForDebugEvent returns one pending event. Until the debugger calls ContinueDebugEvent, target threads remain stopped. Therefore every successful wait must lead to exactly one continue, including error paths.
Some event variants transfer handles to the debugger. The logger closes process, thread, and image-file handles after reading the active union member selected by dwDebugEventCode. It does not guess which union field is valid.
The AttachGuard is the last line of cleanup. If ordinary error propagation leaves the event loop, Drop attempts to detach. Breakpoint restoration still happens explicitly first because detaching a process whose code still contains course hexadecimal C C bytes would be unsafe.
Section: The capstone project.
This tool combines the whole section:
the pattern scanner locates a range or anchor;
the memory wrapper copies bytes;
iced-x86 identifies calls;
the debugger owns breakpoint state;
the logger moves events off the hot path;
RAII — resource acquisition is initialization, the habit of tying cleanup to a value’s lifetime — restores bytes and closes handles.
First prove the logger against a small test target whose source is available. Then run the real capstone against one narrow course target: in Wesnoth 1.14.9, log calls around this value while ending one turn. The optional build reference lists an AssaultCube and an Urban Terror target for the same logger.
Set a limit such as 1,000 events or five seconds. The output should show real module-relative callers and targets from the selected game. Compare the log with x64dbg, then detach and verify every breakpoint byte was restored.
Section: Run the complete Wesnoth logger.
The compiled course tool chooses the Wesnoth main module, asks VirtualQueryEx for readable executable regions, decodes them as x86 with iced-x86, and installs at most 2,000 verified E8 call breakpoints. It excludes two known noisy call sites from the historical lab. When a call fires, it restores E8, rewinds e i p, sets the trap flag, executes the real call once, records the destination e i p, reinserts hexadecimal C C, and continues.
Terminal window
Code example. The surrounding prose explains this example; the full lesson contains the exact code.
Exercise a small Wesnoth path, then press End. The tool restores every installed call byte before detaching. The full code is call_logger.rs; shared memory and region enumeration are in process.rs. The optional build reference gives an order for reading the full source.
This first complete version writes compact lines directly to the console. The bounded-channel design above is the next performance step when you add file output; it is not required to run or reproduce the actual call logger.
Silent video demonstration: Executed calls appearing in a Wesnoth trace. The original call-logger recording shows the running game producing trace output. Each observed call requires a breakpoint hit, execution of the saved call, a single-step event, and re-arming; bytes discovered in a static scan have not necessarily executed.
Section: Compare a trace with a run that changed nothing.
One trace lists what ran while it recorded, but not which calls the action caused: most of them belong to drawing, input and timers that run anyway. To separate the two, fix the scenario first (the build, the save, the logging window and the event cap) and record it twice without changing anything. Then record it once more with a single change, such as recruiting one unit before ending the turn.
The two unchanged runs show how far the counts move on their own. A function the game calls once per frame runs as many times as frames fit in the window, and that depends on timing, so even identical runs disagree. A count in the changed run points at the change only when it falls outside the range the unchanged runs produced.
Predict first
Two runs that only end the turn called wesnoth.exe+hexadecimal 0 E 7 7 1 0 212 and 219 times. A third run that first recruits one unit called it 215 times.
Does recruiting change how often +hexadecimal 0 E 7 7 1 0 runs?
Answer: The counts cannot tell: 215 lies inside the 212 to 219 of the identical runs. A count points at the change only when it falls outside what unchanged runs produce. 215 is inside, so this function may or may not take part in recruiting, and these counts cannot separate the two.

Section: Diagnose by the last completed state.
Troubleshooting by the last completed state
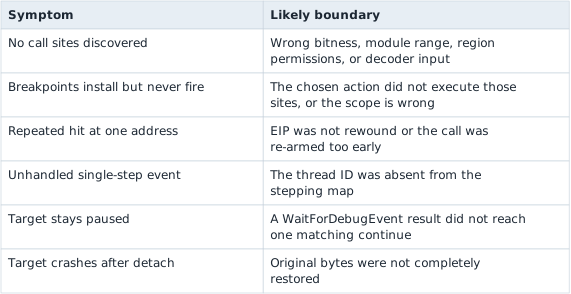
This table is why the state machine is explained explicitly: the symptom tells you which transition to inspect instead of encouraging random breakpoint changes.
Section: Optional build reference.
These notes help when you reproduce the logger on another course game or read its complete source. The breakpoint cycle and bounded record above do not depend on them.
Additional detail: Optional build reference: other capstone targets.
AssaultCube 1.2.0.2: log entries to the internal print function at this value while names are drawn;
Urban Terror 4.3.4: log the render path around the memory-wall hook at this value for one local frame window.
Additional detail: Optional build reference: read the complete source in six passes.
The full call_logger.rs is longer than the scanner because it owns a live state machine. Read it in this order:
Constants and guards — caps, trap flag, known exclusions, detach cleanup.
Thread context helpers — open only the event thread and get or set its suspended register state.
Static discovery — copy executable regions and let iced-x86 return verified call instructions.
Breakpoint transaction — save E8, install hexadecimal C C, and roll back already-installed sites on partial failure.
Exception state machine — pair each breakpoint event with a later per-thread single-step event.
Event loop and shutdown — continue every event once, close transferred handles, restore bytes, and detach.
Do not begin at main and dive into every Windows name. First locate these six responsibilities; then read the helper used by the phase you are studying.