Section: What a breakpoint does.
A breakpoint asks the debugger to pause when a specific event happens. The two kinds we use most are:
code breakpoint — pause when the C P U, central processing unit, reaches an instruction;
memory breakpoint — pause when code reads, writes, or executes at an address.
The pause is useful because the thread’s register state and instruction location are still available. A code breakpoint normally stops before its instruction; a data watchpoint may report an access after the instruction performed it. Inspect the triggering access and the state at the pause before deciding which side of that instruction the debugger shows.
A breakpoint tells you that one condition happened, not why. A write breakpoint on health may fire for damage, healing, loading, respawning, and initialization, all through the same instruction. The action you performed just before the pause, and the call stack at the pause, tell those uses apart.
In brief: A breakpoint says that something happened, not why. The action you just took and the call stack tell you the reason.
Section: A pause is one instant on one thread.
A process can contain many threads. When one thread hits a breakpoint, another may have updated nearby state just before the debugger stopped everything. The snapshot is real, but it is not automatically the whole causal story.
Four kinds of context explain a pause:
time: what player action immediately preceded the pause;
thread: which thread executed the instruction;
data: which registers and memory locations the instruction used; usually only two registers matter, the one that forms the memory address and the one the value moves into or out of;
control: which call path and branches led here.
Repeating the same action shows whether the breakpoint is useful. A useful breakpoint fires at a consistent point for the behavior you are studying. A noisy breakpoint may still be correct, but it needs a stronger filter such as a specific thread, object pointer, call site, or condition.
This is the difference between a trace and an explanation. A trace records what executed. An explanation shows why the input and current state selected that path, and survives repeated tests.
Section: Memory breakpoints.
A hardware breakpoint uses C P U debug registers to watch a small address range. It is ideal when you know the gold address but not the instruction that changes it.
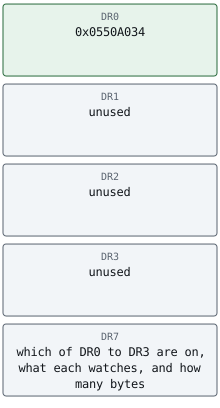
The debug registers can watch for a write, for a read or write, or for an execute — x86 has no read-only setting. A debugger that offers a pure read breakpoint implements it another way, usually with page protection.
Choose the narrowest event that answers your question:
write when looking for code that changes a value;
read when looking for code that uses a value;
access only when you truly need both.
Access breakpoints can fire constantly. More pauses do not automatically mean more understanding.
Hardware watchpoints are limited resources—x86 provides only a small number of debug-address registers per thread—and supported widths/alignment are restricted. A debugger may emulate larger memory watches with guarded pages, which is noisier because unrelated data on the same page can trigger.
Be precise about the event:
an instruction reads when it needs the old bytes;
it writes when it stores new bytes;
a read-modify-write instruction such as sub [address], e a x does both;
execute means the watched bytes are being treated as code.
Watching four bytes does not tell the debugger that they are a u32. Width is about overlapping addresses. Type meaning still comes from the instruction and behavior.
Section: Code breakpoints.
Once a memory breakpoint identifies the instruction that writes gold, a code breakpoint can stop at that instruction on later runs. That makes it easier to compare its callers and branch conditions without watching every write to the field.
On x86, a debugger often implements a software breakpoint by temporarily replacing the first byte of an instruction with hexadecimal C C, the int3 instruction.
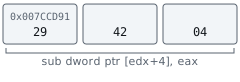
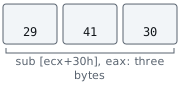
Use a concrete three-byte subtraction as the byte-level example below: sub dword ptr [e d x+4], e a x subtracts the value in e a x from a four-byte field at address e d x+4. The debugger changes only its first instruction byte to set the breakpoint.
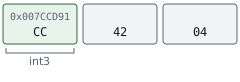
When the C P U executes int3, Windows reports a breakpoint exception. The debugger:
pauses the process;
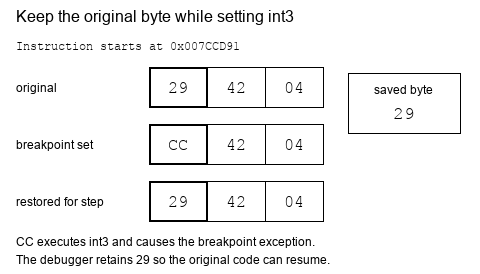
restores the original byte;
lets you inspect or step;
replaces the breakpoint when execution continues.
That bookkeeping is why you should remove breakpoints through the debugger instead of editing the byte by hand.
Alternative: Think of a sticky note over one word in a book: the debugger covers a byte with a marker and keeps the original word safe to put back.
It also means a software breakpoint is not invisible. While it is set, the program’s own code genuinely contains hexadecimal C C where the original byte used to be, and nothing prevents the program from reading its own bytes and noticing. A routine that adds up the bytes of a function and compares the total against a figure recorded when the game was built will disagree the moment you place a breakpoint inside that function.
Notice what such a routine has actually established: that its code changed. It has not detected a debugger, and it cannot tell your breakpoint apart from any other modification to those bytes. Chapter 13 returns to this, because it is the same self-checking idea used to notice a patch.
Section: How a software breakpoint pauses and resumes.
The original instruction still has to execute. A debugger normally handles the hexadecimal C C pause in two events:

The instruction pointer needs rewinding because the C P U has already consumed the one-byte int3. The one-instruction step lets the real instruction run before the breakpoint byte is restored. Lesson 6.10 models this as explicit Armed and Stepping states so the byte is never restored at the wrong time.
On x86, single stepping uses the trap flag in the thread’s flags register. When set, the C P U raises a debug exception after the next instruction. The flag belongs to one thread, which is why debugger state records thread IDs.
Follow the subtraction example through both events. The saved 29 byte must be executable for one instruction before CC can safely be installed again:

Section: Step, step over, and run to return.
When paused at a call, you have choices:
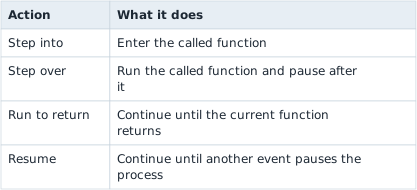

Step into code you need to understand. Step over code that is not part of your question.
“Step over” is not one special C P U instruction. At a call, the debugger can place a temporary breakpoint at the instruction after the call and resume. If the call never returns normally, that temporary breakpoint may never fire.
“Run to return” relies on the current call frame and can be confused by tail calls, exceptions, corrupted stacks, or optimized code. These controls are convenient ways to express a debugging goal, not guarantees about source-level functions.
Section: nop: do nothing once.
nop means “no operation.” Replacing an instruction with one or more nop bytes is a quick, temporary way to test what that instruction does. This is a separate action from setting a breakpoint: it changes what the game executes after you resume.
Code example. The surrounding prose explains this example; the full lesson contains the exact code.
If this removes gold and you temporarily replace the whole instruction with nop bytes, recruiting may stop costing gold. That result supports your theory.
NOPing an instruction removes all of its effects, including effects that are easy to overlook. Arithmetic instructions often update flags used by the next conditional branch. A floating-point store may also pop a value from an x87 stack. A test that appears visually correct can still damage later control flow or machine state.
Narration: A NOP that looks right on screen can still break the game later, because the instruction it removed also set flags that the next jump relied on.
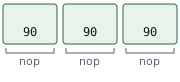
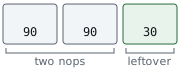
Before patching, ask:
How many complete bytes does the instruction occupy?
Which registers, memory, flags, or special stacks does it change?
Does later code rely on those changes?
What should visibly change in the game if the patch works?
How will the original bytes be restored?
Always save a copy of the original bytes before patching, so they can be written back. An incomplete replacement can make the C P U decode the remaining bytes as a completely different instruction.
Section: Represent debug events as explicit states.
Later, our debugger will receive the same breakpoint events from Windows. We will model them with an enum:
Code example. The surrounding prose explains this example; the full lesson contains the exact code.
An enum gives each event a clear shape. Pattern matching then forces us to decide how every event should be handled instead of silently ignoring surprises.
The next lesson uses x64dbg’s built-in breakpoint controls rather than a custom debugger. Start with the gold address, watch a write, and use the paused registers and instruction to check whether affordability guards the gold write. The enum becomes useful later when we write our own event-handling code.